
The Stansted, Thaxted and Saffron Walden Market
A housing market report for Stansted, Thaxted and Saffron Walden — postcode districts CM24, CM6, CB10 and CB11
with Bishop’s Stortford (CM23) and Sawbridgeworth (CM21) at the edges
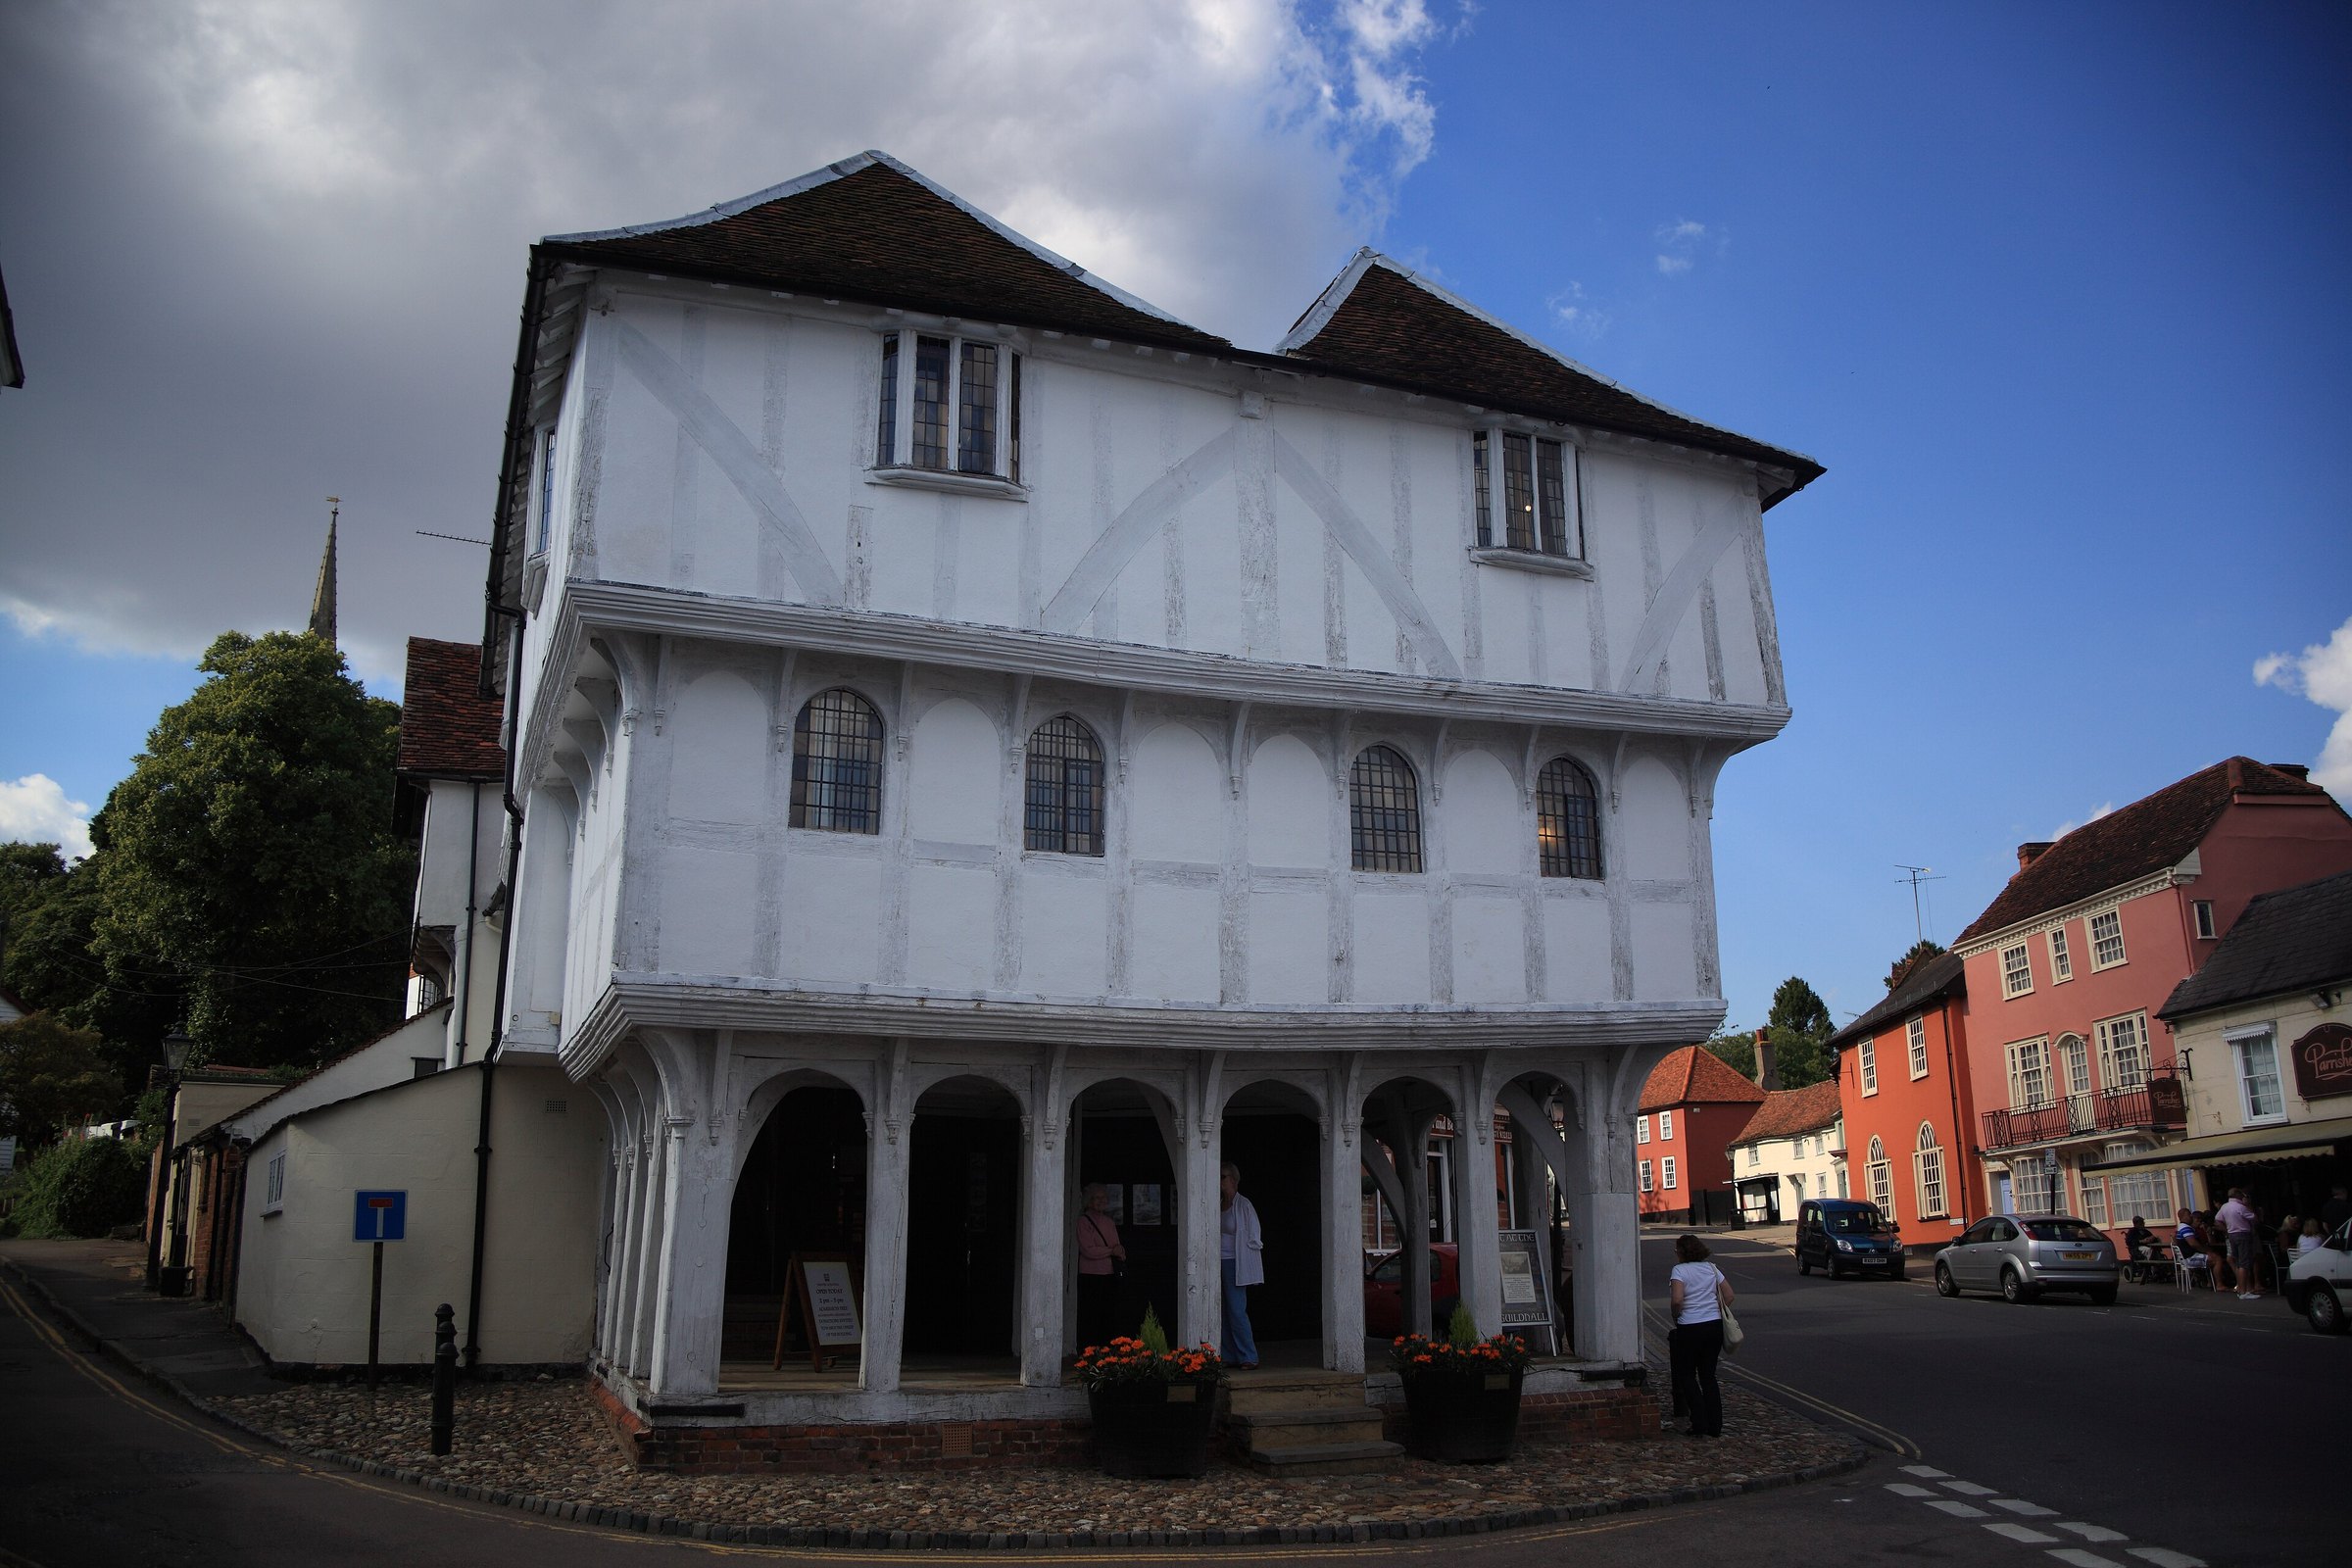
Download the reportGuildhall Thaxted Essex England. Photograph Acabashi, CC BY-SA 4.0, via Wikimedia Commons.
At a glance
Prices in the patch barely moved over the last twelve months. Transactions fell by a third. The median sale was £451,250, 1.9% below the year before, and the upper quartile was £625,000, down 0.9%. What changed was how many homes sold: 908 against 1,361.
The middle sale of 908. Lead on this figure, not the mean.
Open-market sales registered across CM24, CM6, CB10 and CB11, against 1,361 the year before. The most recent months are still registering, so part of this fall is lag. Section 03 says how much the report can and cannot separate.
Exactly the same share as the year before, on 71 fewer sales.
A quarter of sales were above this. It moved less than the median did.
HM Land Registry Price Paid Data, postcode districts CM24, CM6, CB10 and CB11, 26 September 2025 to 25 September 2026. Category A open-market sales only; repossessions, company transfers and other non-market sales are excluded. Downloaded 30 Oct 2026.
The last twelve months
908 open-market sales registered across the four core districts in the year, against 1,361 in the twelve months before. Volume fell 33.3%. The median fell 1.9%, from £459,995 to £451,250. The upper quartile fell 0.9%.
| Last 12 months | Previous 12 months | Change | |
|---|---|---|---|
| Sales | 908 | 1,361 | −33.3% |
| Median | £451,250 | £459,995 | −1.9% |
| Mean | £521,772 | £528,550 | −1.3% |
| Lower quartile | £350,000 | £364,995 | — |
| Upper quartile | £625,000 | £630,496 | −0.9% |
| 90th percentile | £846,500 | £875,000 | — |
| Highest | £3,650,000 | £2,620,000 | — |
| Lowest | £88,000 | £92,000 | — |
Change is shown on sales, median, mean and upper quartile only. A percentage change on a single highest or lowest sale would be noise, so none is printed. Source: HM Land Registry Price Paid Data, 26 September 2025 to 25 September 2026 against 26 September 2024 to 25 September 2025.
Read the median, not the mean
The median sale was £451,250. The mean was £521,772, £70,522 higher. The gap is the work of a thin top tail: 3 sales in the year passed £2m and the largest reached £3,650,000. The median describes the typical sale in this patch. The mean describes the arithmetic of those few large ones.
New build, 61 sales of 908. This patch sells second-hand stock.
Leasehold, 101 sales of 908, close to the 10.9% flat and maisonette share.
The last three months
Land Registry records a sale when it is registered, not when it completes, and that lag runs weeks to months. The 2026 monthly counts for the four core districts read Jan 65, Feb 47, Mar 62, Apr 74, May 75, Jun 60, Jul 85, Aug 62, Sep 26 — September is a part month to the 25th. The settled run rate is 91.0 sales a month (May 2025 to May 2026 inclusive, with March and April 2025 removed as a stamp-duty deadline distortion). The most recent months are still filling, so the quarter’s volumes will rise.
March 2025 recorded 220 sales and April 2025 recorded 39, either side of the 31 March 2025 stamp duty threshold change. Those two months are removed from the run rate above for that reason.
The harder admission. The twelve-month fall of 33.3% is larger than registration lag alone usually explains. January to August 2026 shows 530 sales against 894 in the same eight months of 2025, a fall of 40.7%, and eight months is further back than lag normally reaches. This report cannot apportion that fall between lag and a genuine fall in transactions. Doing so would need an earlier vintage of the same Land Registry file to compare against, and only the current one is published. The limit is repeated in section 13.
| Last 3 months | Same 3 months 2025 | |
|---|---|---|
| Sales | 189 | 346 |
| Median | £430,000 | £467,500 |
| Mean | £503,645 | £551,910 |
| Lower quartile | £355,000 | £375,000 |
| Upper quartile | £595,000 | £650,000 |
| Highest | £3,000,000 | £2,620,000 |
26 June 2026 to 25 September 2026 against 26 June 2025 to 25 September 2025. Source: HM Land Registry Price Paid Data.
What the quarter shows is that the sales registered so far in it sit a little lower in the range than the same quarter last year: the median reads £430,000 against £467,500, and the lower quartile £355,000 against £375,000. What it does not show is that the market has turned. 189 sales in a part quarter cannot carry that conclusion, and this report does not draw it. The sales still to register are not spread evenly across the price range. The figure to watch is the full year in section 02.
Five years
A peak in 2021, a dip through 2023, a recovery to 2025, and 2026 running well behind all of them on volume while the median holds inside the same band it has occupied for six years.
| Year | Sales | Median | Mean | Lower quartile | Upper quartile |
|---|---|---|---|---|---|
| 2019 | 1,160 | £395,000 | £447,162 | £305,000 | £543,124 |
| 2020 | 1,028 | £430,000 | £474,568 | £325,000 | £569,995 |
| 2021 | 1,625 | £430,000 | £495,760 | £330,000 | £595,000 |
| 2022 | 1,266 | £468,500 | £545,796 | £370,000 | £644,500 |
| 2023 | 962 | £450,000 | £515,800 | £350,000 | £609,999 |
| 2024 | 1,167 | £450,000 | £519,163 | £355,000 | £606,500 |
| 2025 | 1,340 | £470,250 | £541,620 | £367,875 | £641,062 |
| 2026 to 25 Sep | 556 | £440,000 | £501,204 | £345,000 | £609,250 |
Postcode districts CM24, CM6, CB10 and CB11. 2026 is a part year to 25 September and is not comparable with the settled years. Source: HM Land Registry Price Paid Data.
Volume is the larger story. 1,625 sales registered in 2021, the peak of the series. 2025 settled at 1,340 and 2026 stands at 556 with the last months still filling. On median, 2021 to 2025 reads £430,000 to £470,250, a rise of +9.4% — our own arithmetic on two figures in the table above, not a published index.
The half-year series is the cleanest view of the price trend, because it smooths the month-to-month noise without hiding a turn. It shows a market that has traded in a band between £425,000 and £475,000 for six years. The final point is a part period and is drawn as one.
| Period | Median | Sales | Period | Median | Sales |
|---|---|---|---|---|---|
| 2021 H1 | £438,000 | 1,095 | 2024 H1 | £454,998 | 476 |
| 2021 H2 | £425,000 | 530 | 2024 H2 | £449,950 | 691 |
| 2022 H1 | £465,000 | 571 | 2025 H1 | £466,475 | 660 |
| 2022 H2 | £470,000 | 695 | 2025 H2 | £475,000 | 680 |
| 2023 H1 | £450,000 | 446 | 2026 H1 | £438,000 | 383 |
| 2023 H2 | £457,500 | 516 | 2026 H2 | £440,000 | 173, part period |
Whole of market
Detached homes are 42.7% of sales across the four core districts and set the top of the market. Flats and maisonettes are 10.9% and set the bottom. Between them sit the semis and the terraces, which are the patch’s working family housing.
| Type | Sales | Share | Median | Mean | Lower quartile | Upper quartile | Median change |
|---|---|---|---|---|---|---|---|
| Detached | 388 | 42.7% | £618,500 | £696,350 | £495,000 | £789,962 | −0.2% |
| Semi-detached | 236 | 26.0% | £425,000 | £460,258 | £370,000 | £500,000 | +0.0% |
| Terraced | 185 | 20.4% | £360,000 | £392,726 | £310,000 | £430,000 | −1.4% |
| Flat / maisonette | 99 | 10.9% | £220,000 | £225,355 | £180,000 | £250,000 | +4.8% |
Change column compares the median with the previous twelve months, when detached read £620,000 on 618 sales; semi-detached read £425,000 on 321 sales; terraced read £365,000 on 286 sales; flat / maisonette read £210,000 on 136 sales. Source: HM Land Registry Price Paid Data.
No property type moved
Across detached, semi-detached, terraced and flats, the twelve-month median changed by between −1.4% and +4.8%. Nothing in the patch’s housing stock went anywhere. That is the honest reading of the table above, and it is why this report leads on volume rather than on price.
The divergence that is in this data is between districts, not between types
In CM24 the lower quartile moved +1.4% (£350,000 to £355,000) while the upper quartile moved +12.1% (£557,500 to £625,000). The whole of the movement sits in the upper half of the district. That is the signature of a different mix of homes selling, not of a uniform revaluation. On 105 sales a year, a 9% median move is well inside what a change of mix can produce.
In CB11 the opposite shape: the upper quartile barely moved (£700,000 to £695,000, −0.7%) and the lower quartile moved −3.8%, while the median fell 8.0%. The change is in the middle of that district’s stock.
The practical point for an owner is that neither district’s headline figure should be used to price a specific house — and that the two districts sit at the same median, £460,000, having arrived there from opposite directions.
Price bands
84.3% of sales in the patch land below £750,000. Above £1.5m there were 8 sales in the whole twelve months across all four districts.
The shape matters for anyone setting a guide price. The patch has real depth below £500,000, where 533 sales happened, and real depth between £500,000 and £1m, where 332 did. Above £1m the market is 43 sales a year. Above £1.5m it is 8. A home guided at that level is competing in a market of single figures, and its guide price has to be set off named comparable evidence for the road rather than off any distribution. The share figures are our own arithmetic on the counts in the chart above.
Pounds per square foot
Land Registry Price Paid Data carries no floor area, so no rate per square foot can be derived from the sales in this report. That is a property of the source, not an omission.
What was tried: on 30 Oct 2026, the publisher used for the county rate had no page for Uttlesford, Saffron Walden, Thaxted or Stansted. All four returned HTTP 404. The figures below are Essex county figures and are labelled as county figures.
Essex, October 2025 to September 2026. Plumplot, Essex house prices per square metre, derived from HM Land Registry Price Paid Data. These are county rates, not rates for this patch. Fetched 30 Oct 2026.
The patch’s own median, £451,250, sits above the Essex average of £359,433, so the rate per foot here will sit above £393 a square foot. This report does not put a number on it, because any number it printed would be an estimate dressed as a measurement.
For direction of travel, the same source puts Essex at £4.2k per square metre in 2022, 2023 and 2025 and £4.1k in 2024 and 2026, against England and Wales at £3.6k in 2026. The county rate has been flat for five years and sits about a seventh above the national one.
The high-value segment
143 homes sold at £750,000 or more across the four core districts in the twelve months, 15.7% of all sales — the same share as the year before, when there were 214. Their median was £920,000.
| The segment | Last 12 months | Previous 12 months |
|---|---|---|
| Sales | 143 | 214 |
| Share of all sales | 15.7% | 15.7% |
| Median | £920,000 | £916,000 |
| Mean | £1,019,308 | £1,025,538 |
| Lower quartile | £805,000 | £832,250 |
| Upper quartile | £1,067,500 | £1,150,000 |
| 90th percentile | £1,308,000 | £1,347,000 |
| Highest | £3,650,000 | £2,620,000 |
26 September 2025 to 25 September 2026 against 26 September 2024 to 25 September 2025. Source: HM Land Registry Price Paid Data.
| Type | Sales | Share of segment | Median |
|---|---|---|---|
| Detached | 122 | 85.3% | £917,500 |
| Semi-detached | 13 | 9.1% | £960,000 |
| Terraced | 8 | 5.6% | £867,500 |
By property type within the segment, last 12 months.
Detached homes are 85.3% of the segment. No flat or maisonette sold at £750,000 or above anywhere in the four core districts in the twelve months — that is a real finding and a thin-data note at once, and it is a clear difference from towns where a large flat is an ordinary event. A semi-detached house at £960,000 and a terrace at £867,500, on the other hand, both happened.
| Year | Sales at £750k and above | Share of all sales | Median | Mean |
|---|---|---|---|---|
| 2019 | 97 | 8.4% | £885,000 | £974,811 |
| 2020 | 104 | 10.1% | £896,500 | £996,427 |
| 2021 | 215 | 13.2% | £900,000 | £1,006,625 |
| 2022 | 208 | 16.4% | £950,000 | £1,066,689 |
| 2023 | 136 | 14.1% | £940,000 | £1,047,042 |
| 2024 | 171 | 14.7% | £900,000 | £1,043,797 |
| 2025 | 227 | 16.9% | £915,000 | £1,036,380 |
| 2026 to 25 Sep | 73 | 13.1% | £920,000 | £1,000,252 |
2026 is a part year still registering. Its 13.1% share is not comparable with the settled years and must not be read as a fall.
Highest recorded sales, last twelve months
| Price | Street | District | Date | Type |
|---|---|---|---|---|
| £3,650,000 | Abbey Street, Ickleton, CB10 1SS | CB10 | 21 Nov 2025 | Detached |
| £3,150,000 | Church Hill, Ashdon, CB10 2HF | CB10 | 26 Sep 2025 | Detached |
| £3,000,000 | Bury Chase, Felsted, CM6 3DQ | CM6 | 3 Jul 2026 | Detached |
| £1,950,000 | Onslow Green, Barnston, CM6 3PR | CM6 | 9 Oct 2025 | Detached |
| £1,799,216 | White Roding, CM6 1RY | CM6 | 29 May 2026 | Detached |
| £1,700,000 | Pharisee Green, CM6 1JN | CM6 | 17 Oct 2025 | Detached |
| £1,700,000 | Mill Road, Felsted, CM6 3HQ | CM6 | 7 Aug 2026 | Detached |
| £1,650,000 | Royston Road, Wendens Ambo, CB11 4JX | CB11 | 27 Mar 2026 | Detached |
| £1,435,000 | Pepples Lane, Wimbish, CB10 2XB | CB10 | 14 Apr 2026 | Detached |
| £1,421,250 | Mount Pleasant Road, CB11 3EA | CB11 | 30 Jan 2026 | Semi-detached |
Street and postcode only. House names are on the public record but are not printed here. Dates are registration dates, not completion dates. 26 September 2025 to 25 September 2026.
The patch in context
The patch median of £451,250 sits against an Uttlesford average of £468,166, an England average of £293,525 and a United Kingdom average of £273,037. Read the next passage before using any of those ratios.
| Area | Figure | Measure | Change on the year | Period | Source |
|---|---|---|---|---|---|
| The patch, CM24 + CM6 + CB10 + CB11 | £451,250 | Median | −1.9% | 26 Sep 2025 to 25 Sep 2026 | Land Registry Price Paid |
| Uttlesford | £468,166 | Average | +0.1% | Aug 2026 | UK House Price Index |
| Essex | £359,433 | Average | −0.3% | Aug 2026 | UK House Price Index |
| East of England | £337,848 | Average | +0.2% | Aug 2026 | UK House Price Index |
| England | £293,525 | Average | +0.4% | Aug 2026 | UK House Price Index |
| United Kingdom | £273,037 | Average | +0.9% | Aug 2026 | UK House Price Index |
August 2026 is the latest month published in the UK House Price Index full file downloaded for this edition. Our own figure is a median over the twelve months to 25 September 2026.
Median against average
Ours is a median, the comparators are averages. A median is the middle sale of the set; an average is the arithmetic mean of all of them, and in a market with a long top tail it sits above the median. Our own mean is £521,772, £70,522 above our own median.
So the patch median sitting below the Uttlesford average is a difference in measure at least as much as a difference in market. Compared mean to mean, the patch’s £521,772 sits above Uttlesford’s £468,166. The ratios here are an order of magnitude and not a precise multiple: the patch median is 1.54 times the England average, and compared mean to mean that gap would be wider, not narrower. Both ratios are our own arithmetic on two figures in the table above.
By type, county against patch
| Type | Uttlesford average | Patch median |
|---|---|---|
| Detached | £716,088 | £618,500 |
| Semi-detached | £439,513 | £425,000 |
| Terraced | £364,693 | £360,000 |
| Flat / maisonette | £203,116 | £220,000 |
County figures are UK House Price Index averages for August 2026. Patch figures are Land Registry medians for the twelve months to 25 September 2026. The two are different measures over different periods and are set side by side for scale, not for arithmetic.
Nearby towns
| Post town | Median | Sales |
|---|---|---|
| Saffron Walden | £470,000 | 384 |
| Buntingford | £470,000 | 127 |
| Stansted | £460,000 | 105 |
| Hertford | £450,000 | 503 |
| Ware | £450,000 | 475 |
| Dunmow | £446,750 | 414 |
| Bishop's Stortford | £444,500 | 762 |
| Sawbridgeworth | £427,000 | 131 |
| Chelmsford | £405,000 | 2,200 |
| Harlow | £344,000 | 914 |
| Braintree | £335,000 | 800 |
| Halstead | £325,000 | 319 |
Twelve-month medians. Every row is our own figure from the same HM Land Registry Price Paid Data files, Category A only, for the same window — none is borrowed from a third party. Two notes. The Stansted and Dunmow rows equal the CM24 and CM6 district rows exactly, because in this data the post town maps one to one onto the district. The CB10 + CB11 districts recorded 389 Category A sales in the twelve-month window, of which 5 are registered in Cambridgeshire. The nearby-towns table is built from an Essex and Hertfordshire extract, so its Saffron Walden row reads 384. Verified by direct count, 30 October 2026.
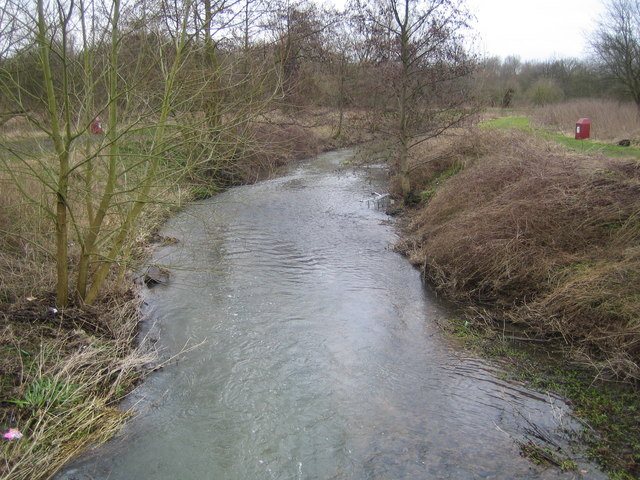
Bishop's Stortford (CM23)
This district is an edge. It gets a short section, not equal billing with the four core districts.
577 sales in the twelve months against 836, a fall of 31.0%. The median was £430,000, −3.4%. 63 sales at £750,000 and above, 10.9% of the district.
Leasehold runs at 17.9% of sales here, the highest of the six districts in this report and well above the 11.1% in the core patch — a town-centre flat market that the core districts do not have.
CM23 straddles the county line: of 6,051 Category A sales since January 2019, 5,824 are in East Hertfordshire and 226 in Uttlesford, Essex.
| Last 12 months | Previous 12 months | Change | |
|---|---|---|---|
| Sales | 577 | 836 | −31.0% |
| Median | £430,000 | £445,000 | −3.4% |
| Mean | £484,147 | £487,833 | — |
| Lower quartile | £340,000 | £339,500 | — |
| Upper quartile | £575,000 | £580,625 | — |
| Sales at £750k and above | 63 (10.9%) | — | — |
New build 7.8% of sales, leasehold 17.9% of sales, last twelve months. Administrative districts across all 6,051 Category A sales since January 2019: 5,824 East Hertfordshire, 226 Uttlesford, 1 Watford. Source: HM Land Registry Price Paid Data.
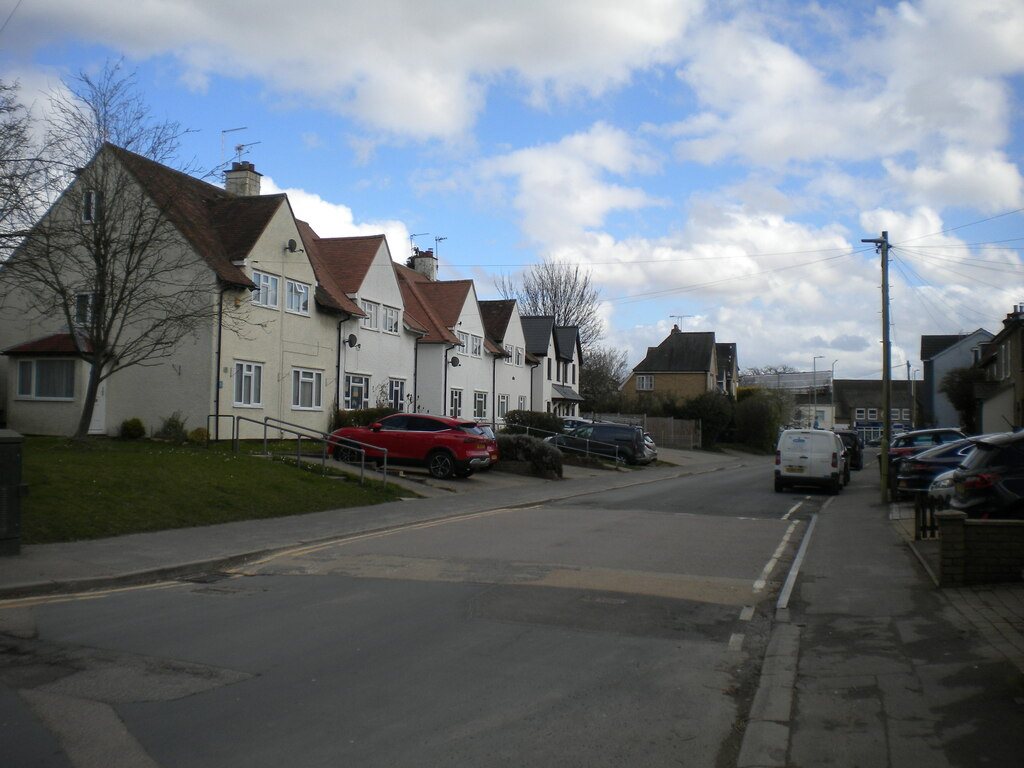
Sawbridgeworth (CM21)
This district is an edge. It gets a short section, not equal billing with the four core districts.
131 sales in the twelve months against 216, a fall of 39.4%. The median was £427,000, −10.2%. 13 sales at £750,000 and above. Leasehold 22.9% — the highest share in this report. No new build at all: 0.0% of 131 sales.
CM21 also straddles the county line: of 1,588 Category A sales since January 2019, 1,258 are in East Hertfordshire and 330 in Epping Forest, Essex. Muvin’s office is at 25 Bell Street, Sawbridgeworth, Hertfordshire CM21 9AR.
| Last 12 months | Previous 12 months | Change | |
|---|---|---|---|
| Sales | 131 | 216 | −39.4% |
| Median | £427,000 | £475,750 | −10.2% |
| Mean | £453,320 | £514,194 | — |
| Lower quartile | £287,750 | £315,250 | — |
| Upper quartile | £540,000 | £621,250 | — |
| Sales at £750k and above | 13 (9.9%) | — | — |
New build 0.0% of sales, leasehold 22.9% of sales, last twelve months. Administrative districts across all 1,588 Category A sales since January 2019: 1,258 East Hertfordshire, 330 Epping Forest. Source: HM Land Registry Price Paid Data.
The map
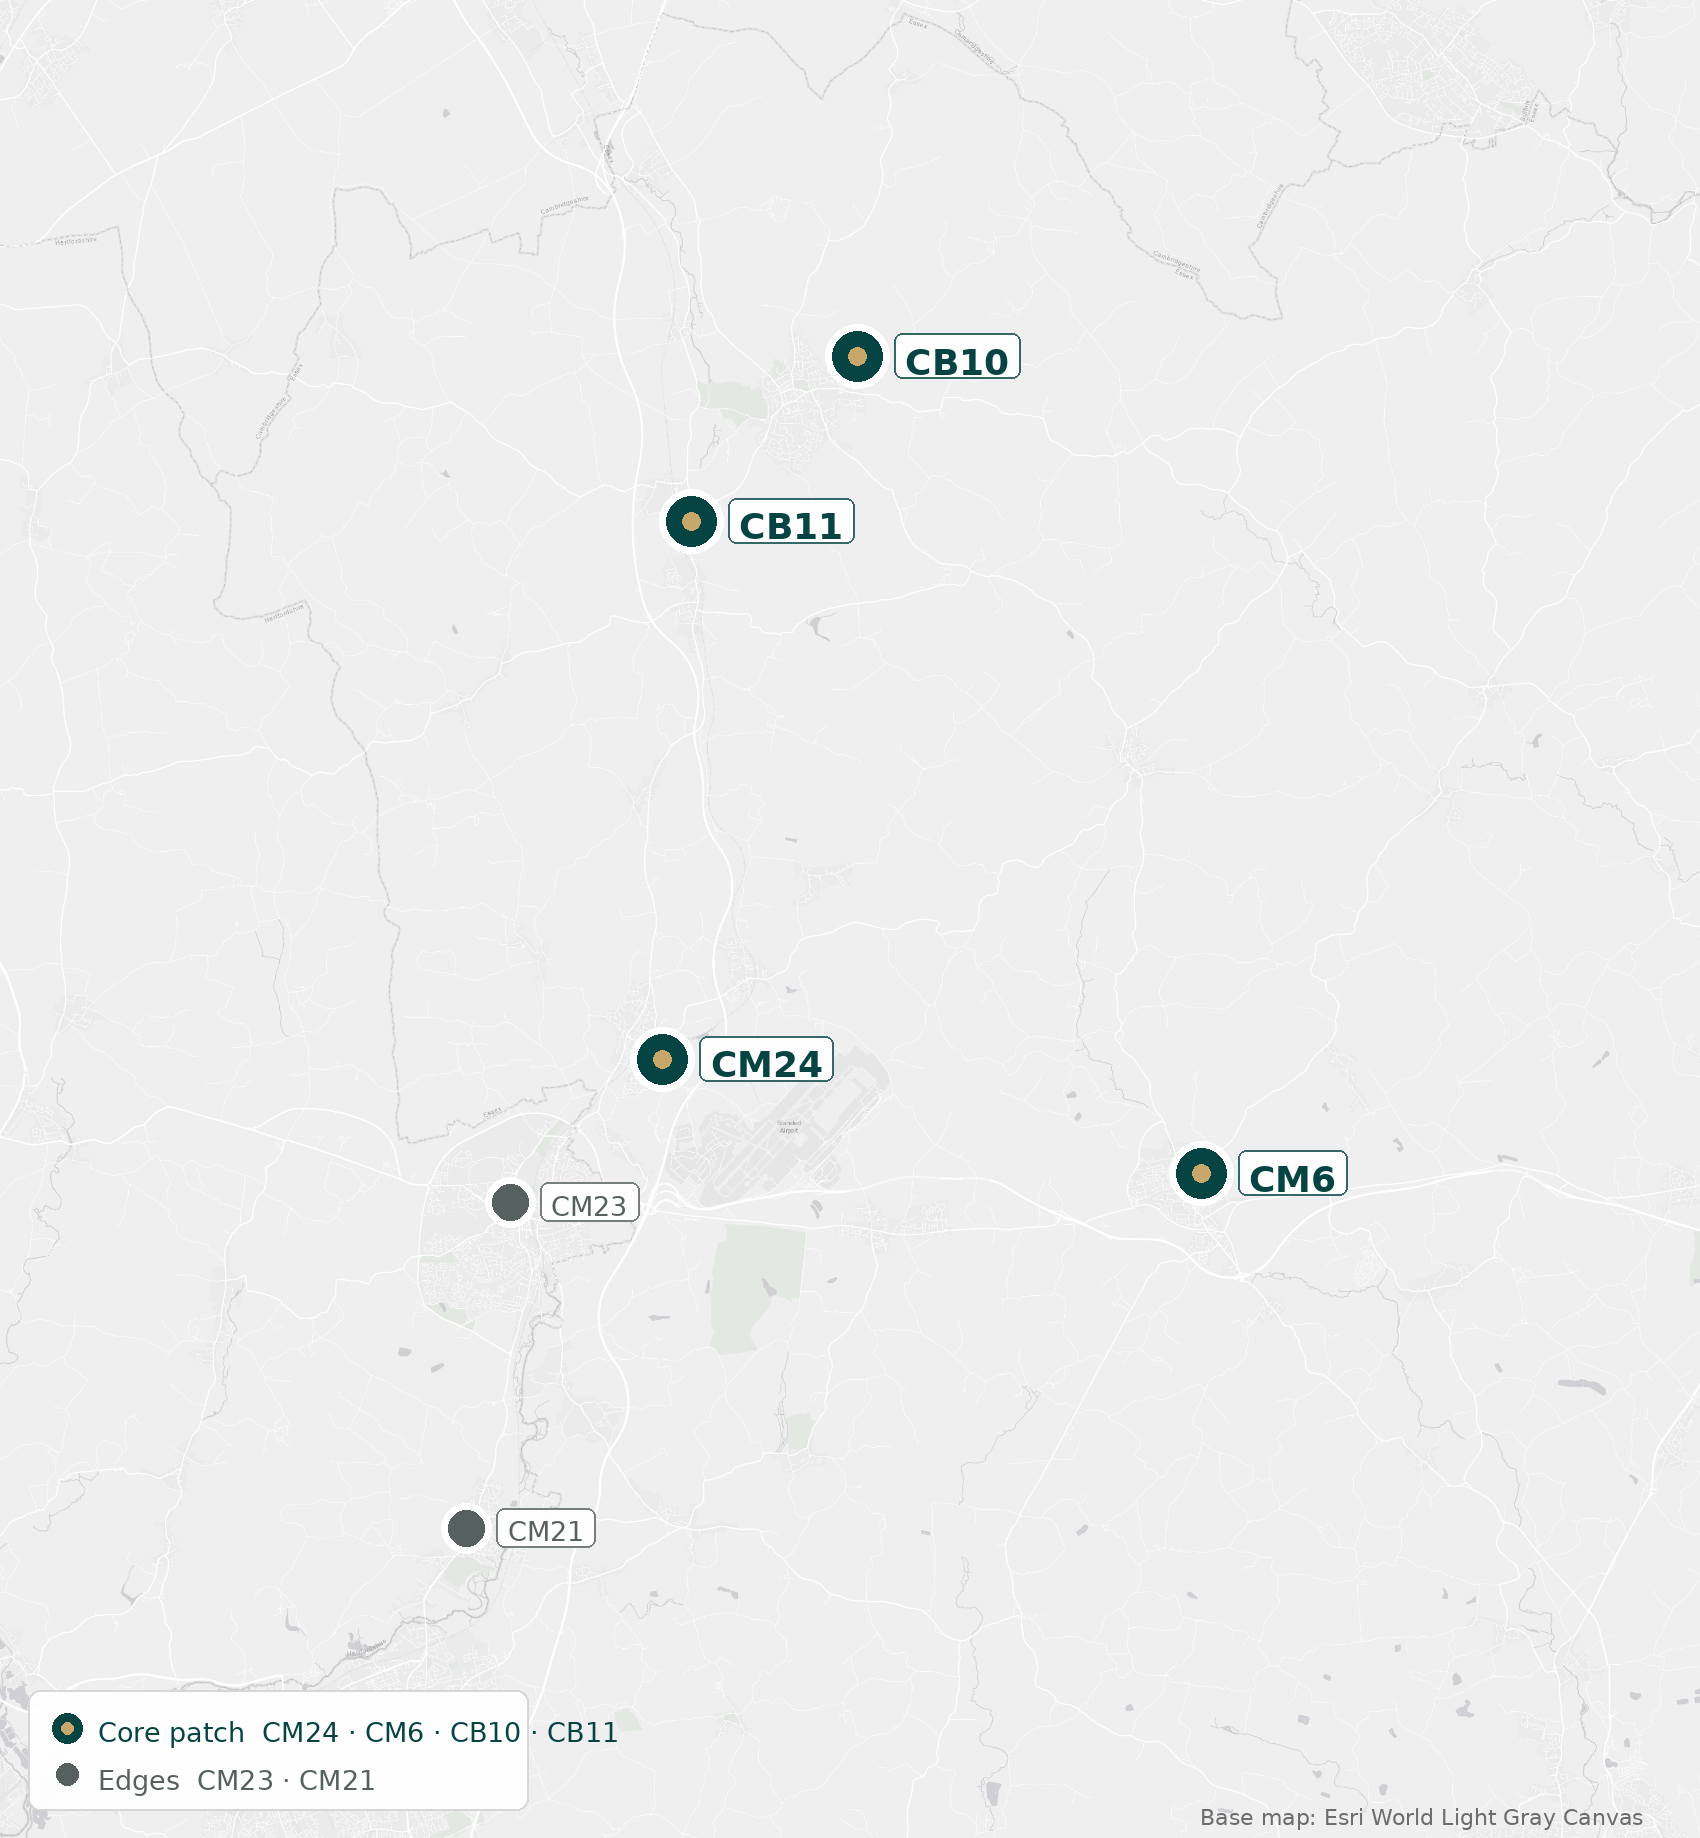
All four core districts sit within Uttlesford. CM24 is the cleanest fit of district to town in the set: every one of its 1,051 Category A sales since January 2019 is in Uttlesford, Essex, and the post town is Stansted.
CM6’s post town is Dunmow, not Thaxted, and that has to be said plainly. CM6 is the Great Dunmow and Thaxted district. Thaxted is a locality inside it: 377 Category A sales since January 2019 out of 4,057 in the district, and 41 in the last twelve months. This report gives CM6 as a district because that is the unit the data supports. Thaxted on its own is too thin to carry its own price series — 41 sales in a year, 1 of them above £750,000.
CB10 and CB11 share the post town Saffron Walden. CB11 is the town and the ground south of it; CB10 reaches east and north and straddles the county boundary, with 1,601 of its 1,676 sales in Uttlesford, Essex and 75 in South Cambridgeshire. The two edge districts, CM23 and CM21, both straddle the Hertfordshire and Essex line as set out in sections 10 and 11.
District centroids and administrative districts from the Postcodes.io outcode API, read 30 October 2026. Base map Esri World Light Gray Canvas; its attribution is carried in the image.
Method and sources
The sales figures come from HM Land Registry Price Paid Data, bulk yearly files pp-2019.csv to pp-2026.csv, downloaded 30 Oct 2026 and filtered to the six postcode districts in this report. The filtering and every statistic were produced by analyse.py, which is filed alongside this report with the data file every figure traces to.
16,743 Category A open-market sales across the six districts since January 2019 — 9,104 of them in the four core districts and 7,639 in the two edges. 2,051 Category B records were excluded, 1,224 in the core and 827 in the edges. Category B is repossessions, buy-to-let portfolio transfers, company transfers and sales not at full market value. That exclusion is why these figures run below the ones the portals publish.
Land Registry records a sale when it registers rather than when it completes, so the most recent months are still filling and those volumes will rise. Where a figure comes from somewhere else it is named on the page beside it.
What this report does not tell you
- No pounds per square foot for this patch. Land Registry carries no floor area. The Essex county rate is given in section 07 and labelled as the county rate. No district or town page exists on that publisher; four were tried on 30 October 2026 and all returned HTTP 404.
- How much of the 33.3% fall in sales is registration lag and how much is a real fall in transactions. Separating the two needs an earlier vintage of the same Land Registry file to compare against, and only the current one is published. The direction is clear; the magnitude is not yet settled.
- No price series for Thaxted on its own. 41 Category A sales in the last twelve months is too thin to carry one. CM6 is given as a district instead, and the Thaxted count is printed in section 12.
- No average time to sell, and no gap between asking price and sold price. Neither is published for these districts in a source reached and verified for this edition.
- No current stock, new listings or price reductions. Those describe what is on the market now. This report describes what has sold.
- No forecast. The tables end on 25 September 2026 and so does the report.
Sources
- HM Land Registry Price Paid DataPrimary source. Bulk yearly files pp-2019.csv to pp-2026.csv, filtered to the six postcode districts, Category A sales only.http://prod.publicdata.landregistry.gov.uk.s3-website-eu-west-1.amazonaws.com/
- HM Land Registry UK House Price Index, full file, August 2026The county, region and country averages and the by-type averages in section 09.http://publicdata.landregistry.gov.uk/market-trend-data/house-price-index-data/UK-HPI-full-file-2026-08.csv
- Plumplot, Essex house prices per square metreThe county square-foot and square-metre rates in section 07, derived from Land Registry Price Paid Data.https://www.plumplot.co.uk/Essex-house-prices-per-square-metre.html
- Postcodes.io outcode APIDistrict centroids and administrative districts for the map in section 12.https://api.postcodes.io/outcodes/CM24
- Esri World Light Gray CanvasBase map in section 12.https://server.arcgisonline.com/arcgis/rest/services/Canvas/World_Light_Gray_Base/MapServer
- MuvinDan McLeod’s contact details and the Muvin office address.https://muvin.co.uk/about-us/meet-the-team/dan-mcleod/
All sources fetched 30 October 2026. Percentage changes and ratios described as our arithmetic are calculated from the figures in the tables on this page.
Photographs
- Guildhall Thaxted Essex England. Photograph Acabashi, CC BY-SA 4.0, via Wikimedia Commons.
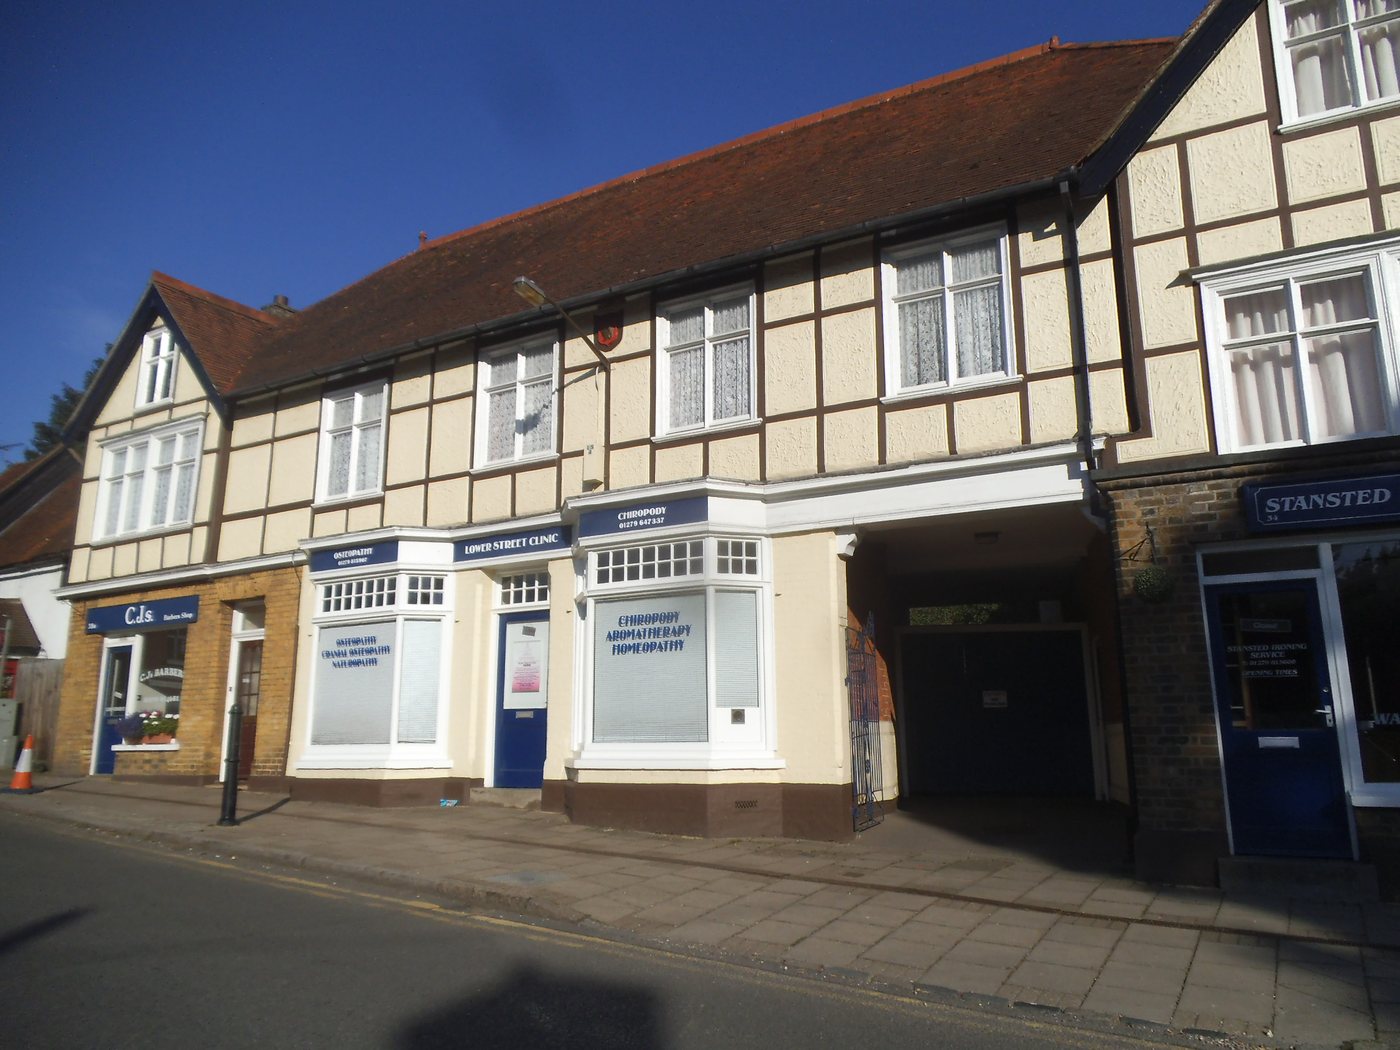
- Shops on Lower Street, Stansted Mountfitchet - geograph.org.uk - 5516629. Photograph David Howard, CC BY-SA 2.0, via Wikimedia Commons.
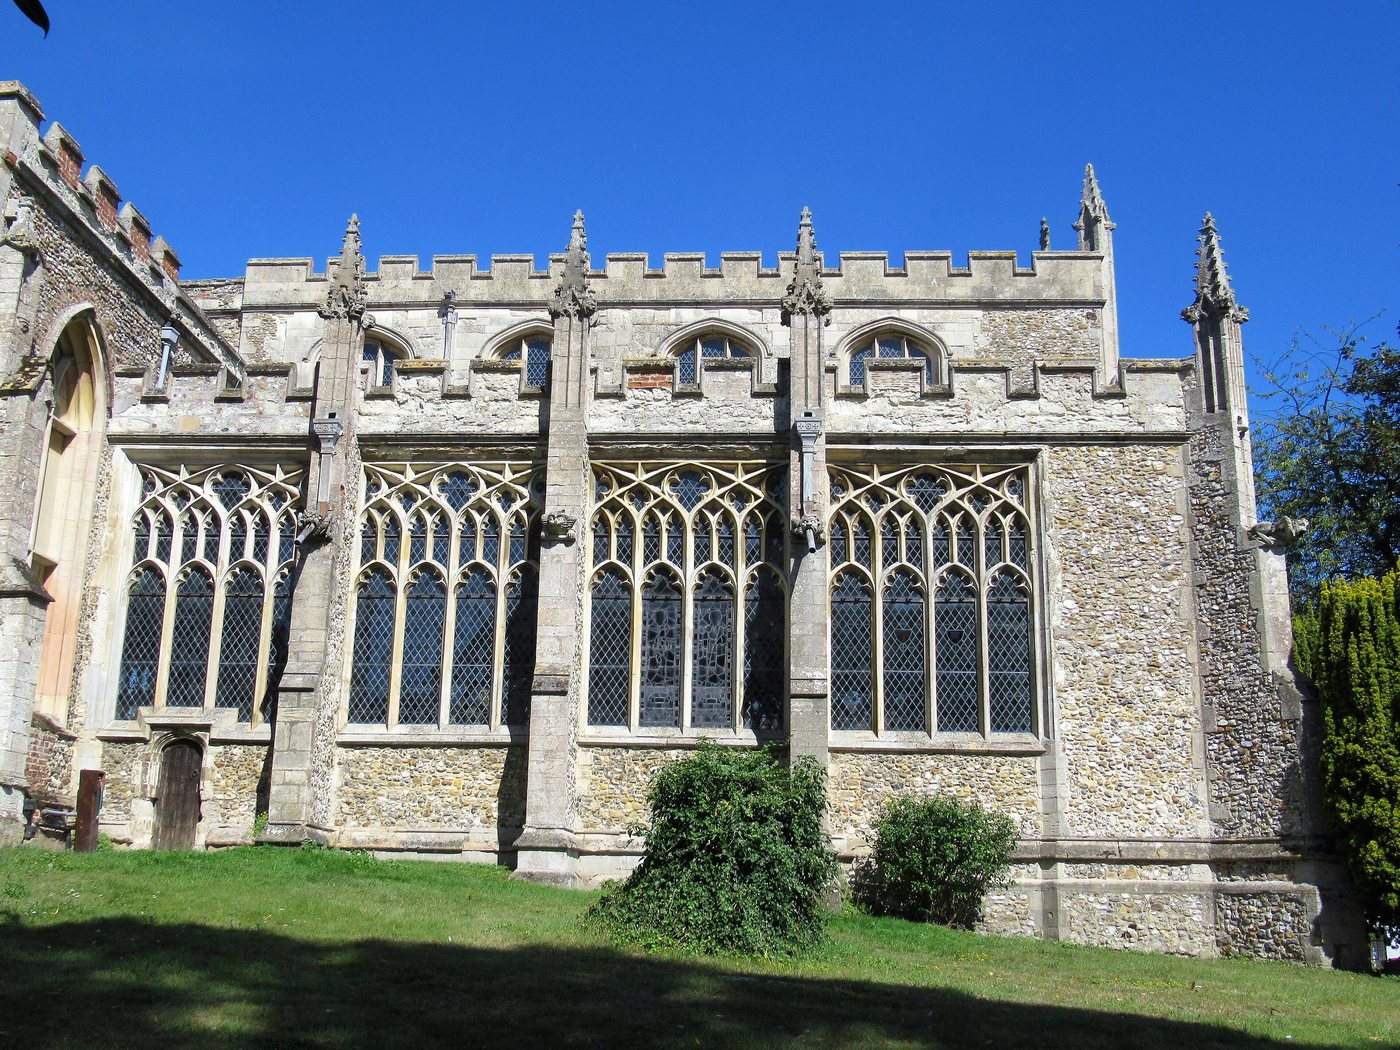
- Thaxted church, east end. Photograph Poliphilo, CC0, via Wikimedia Commons.
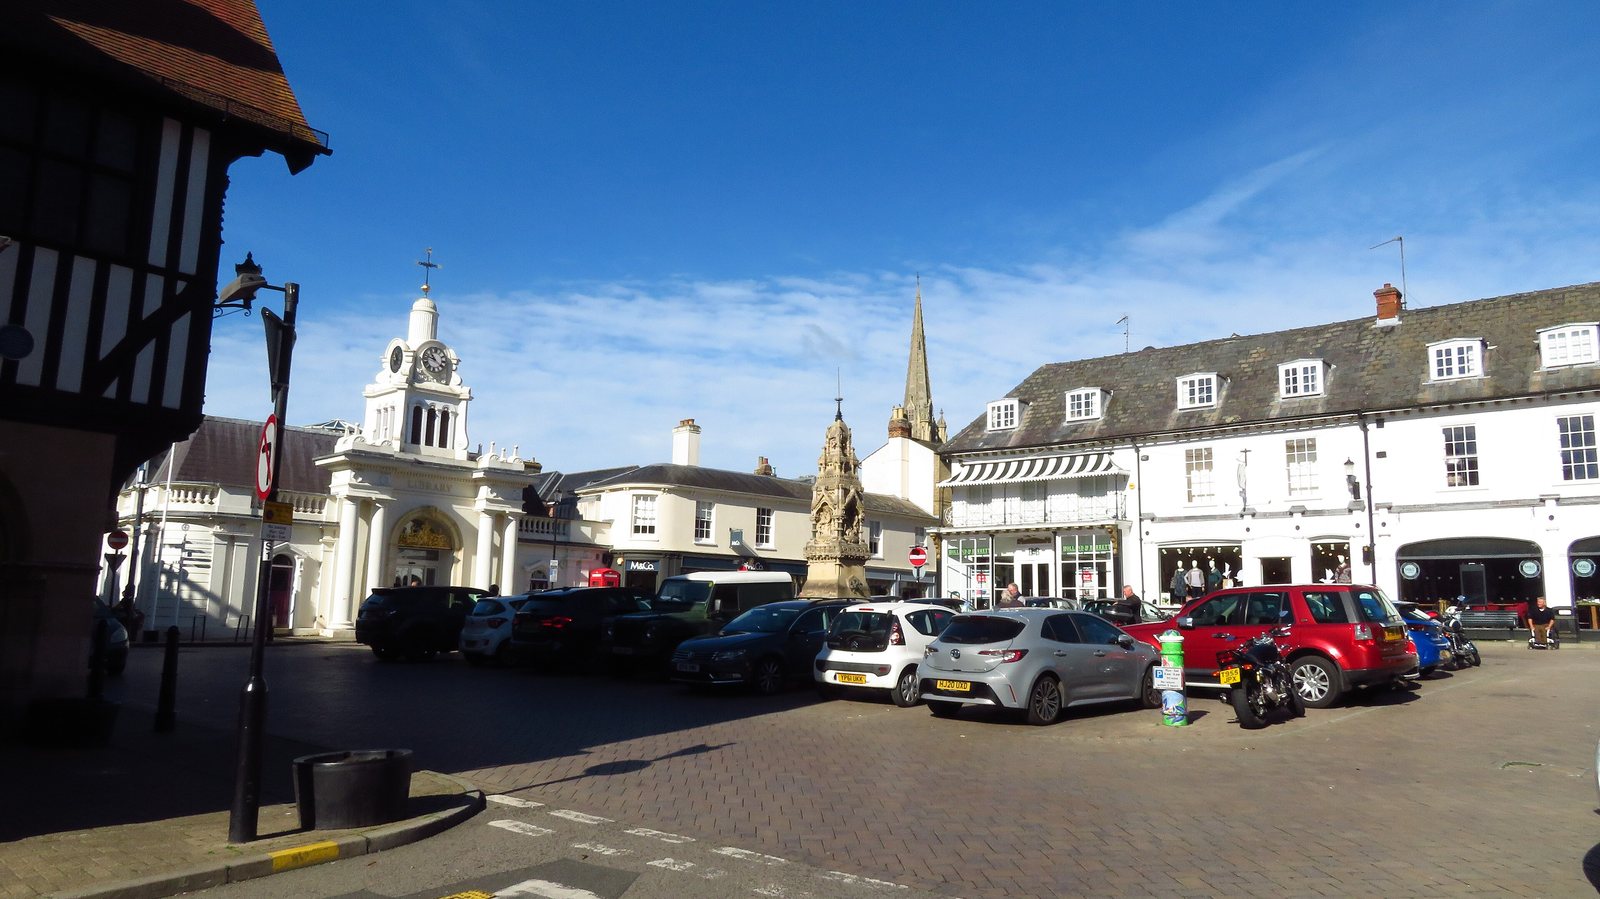
- Saffron Walden - Market Square - geograph.org.uk - 7381128. Photograph Colin Park, CC BY-SA 2.0, via Wikimedia Commons.
- High Street, Saffron Walden - geograph.org.uk - 5466941. Photograph M J Richardson, CC BY-SA 2.0, via Wikimedia Commons.
- River Stort in Bishop's Stortford - geograph.org.uk - 350804. Photograph Nigel Cox, CC BY-SA 2.0, via Wikimedia Commons.
- West Road, Sawbridgeworth - geograph.org.uk - 7178791. Photograph Richard Vince, CC BY-SA 2.0, via Wikimedia Commons.
Sales data from HM Land Registry Price Paid Data, which is Crown copyright and database right, used under the Open Government Licence v3.0.
A conversation about one house
This report describes 908 sales across four postcode districts. It cannot tell you what your own house is worth, because that turns on the plot, the condition, the aspect and what else is available the week it goes on. A district median is the middle of hundreds of different houses; yours is one of them.
If you want that figure, ask for it and I will work it off the comparable evidence for your road rather than off a district-wide median — and I will show you the sales it rests on.
Partner agent, Muvin
The Stansted, Thaxted and Saffron Walden Market, a housing market report for postcode districts CM24, CM6, CB10 and CB11, October 2026. Written by Dan McLeod. Published by Muvin. Muvin T/A eXp World UK Limited, company number 12016573, registered at C/O Corporation Service Company (UK) Limited, 114 St Martin’s Lane, London WC2N 4BE. Sales data from HM Land Registry Price Paid Data, which is Crown copyright and database right, used under the Open Government Licence v3.0. Figures are historic records of completed sales and are not a valuation of any individual property.